Industry · Hotels · Commercial · Residential

Energy metering, control and savings for industry and buildings.

We meter electricity, water, domestic hot water, thermal energy and gas by building, line or machine, and control your equipment from our own platform. With our partner engineering firm, we turn the data into a savings plan and check its results with the same meters.

Protocols
LoRaWAN, M-Bus, Modbus TCP/RTU and BACnet
Integration
Data export and an API to bring the data into your systems
Homes
More than 1,500 in rental developments in Valencia, Tarragona, Torrejón, Pamplona, Almería and other cities

Try a rule

Sample data

Choose a site and switch the rule on or off.

Industrial building · compressed air

Rule
When

From 22:00 to 06:00, outside shift hours

If

the compressor starts

Then

stop it and close the main air valve

Daily consumption528 kWh
From 22:00 to 06:008 kWhWithout the rule: 80 kWh
Hourly consumptionWith the ruleWithout the ruleRule window
  1. Compressor stopped. Main air valve closed
  2. Checked on the meter: the compressor has not restarted
  3. Main air valve open. Compressor running
See the hourly data
Hourly consumption, in kWh
HourWithout the ruleWith the rule
00:00101
01:0091
02:00101
03:00111
04:0091
05:00101
06:003030
07:003434
08:003636
09:003535
10:003737
11:003333
12:002828
13:003131
14:003535
15:003636
16:003434
17:003333
18:003232
19:003030
20:002929
21:002727
22:00111
23:00101

How we work

From data to savings.

A meter on its own saves nothing. With the data and its history in front of us, we work out with our partner engineering firm which technical solutions pay off, and we carry out the improvements. For every investment, you get the before-and-after data, measured with the same meters.

  1. 01

    Measure

    A metering plan and in-house installation, including on sites already in operation. If you already have meters, we integrate them where possible.

    Electricity, water, domestic hot water, thermal energy and gas

  2. 02

    Analyse

    A baseline and indicators per unit produced or per building, with our partner engineering firm. The platform alerts you to consumption outside shift hours, leaks and equipment that stops communicating.

    Data for audits and ISO 50001

  3. 03

    Improve

    Measures prioritised by impact. Our own team carries out the installation and control measures: valves, pumps, relays and HVAC, manually or with rules based on time, temperature or consumption.

    In-house installation and automation

  4. 04

    Verify

    Together with our partner engineering firm, we compare consumption with the baseline, measured with the same meters.

    Reports by period

Sectors

Industry, hotels, commercial and residential buildings.

The same way of working, adapted to what each site and the people who run it need: operation, monitoring, control and savings.

Industry
Electricity, water, domestic hot water, thermal energy and gas by building, line and machine. Energy cost per unit produced, consumption outside shift hours and during shutdowns, alerts, and starting or stopping equipment to match shifts. If you already have meters, we integrate them where possible. More on industry
Hotels
Domestic hot water and HVAC by floor, live plant-room views, temperature-controlled recirculation pumps, and HVAC control.
Offices and commercial buildings
Consumption by end use and by tenant, and tracking of the building’s performance.
Residential and co-living
More than 1,500 homes for rent: consumption by development, cost allocation, common areas and the resident app. More on rental housing
Private houses
Air-source heat pump, solar PV and buffer tanks in a single app, with consumption by tariff period and a forecast of the month’s bill.
For management
Traceable data for energy audits, ISO 50001 and ESG reporting.
Private house

Air-source heat pump, solar panels, fireplace and boiler, on a single dashboard.

Equipment from several brands talks to a local controller. The air-source heat pump follows the sun: when there is surplus solar output, it raises its setpoint and stores that heat in the buffer tank. And the month’s bill is forecast line by line, as the energy supplier prints it.

  • Several brands, one system. Air-source heat pump over Modbus RTU, inverter and meter over Modbus TCP, sensors, pumps, valves and an industrial PLC.
  • Follows the sun. It raises the setpoint in four steps, based on the grid meter reading, and adjusts it to each tariff period.
  • Every command confirmed. The air-source heat pump reads back every setpoint written to it. If a reading goes stale, it switches to a safe setpoint.
  • Safety takes priority. The fireplace protection and the overtemperature protection always override manual mode.
  • Shadow mode before changeover. A new PLC makes its decisions on live data and is compared with the existing controls every two seconds before it takes over.
  • Bill forecast. Actual and forecast amounts shown separately, with a price range and a confidence level.
Live schematicP2 · mid-peakFollows the sunBuffer tank → domestic hot water
  • Solar PV2.7 kW
  • House2.5 kW
  • Gridexporting 0.2 kW
  • Air-source heat pumpstep 2 of 4 · 50 → 57 °C
  • Buffer tank56 · 52 · 47 · 41 °C
  • Domestic hot water52 °C
Sample data
Bill forecast · OctoberHigh confidence
Forecast for the month€92.11Between €74 and €101 based on prices over the last 12 months
Actual so far€48.34Day 17 of 31
ItemActualForecastMonth
Capacity charge3.422.816.23
Network and system charges1.862.144.00
Meter rental0.450.380.83
Energy34.6031.2065.80
Export credit−2.30−2.10−4.40
Electricity tax1.921.743.66
VAT8.397.6015.99
Total48.3443.7792.11
Sample data

Residential and co-living

The whole portfolio on a single platform.

Each development comes with its own systems, meters and maintenance. We bring them together in one place, with the same alerts and reports for all of them. Today that means more than 1,500 homes in Valencia, Tarragona, Torrejón, Pamplona, Almería and other cities.

  • Consumption by development

    Water, domestic hot water, thermal energy and electricity for each building, comparable between developments and between periods.

  • Cost allocation

    Each home pays for what it uses and can check it. The owner receives each home’s total for every billing period.

  • Common areas and plant room

    Centralised thermostats, domestic hot water production, pumps and irrigation, with alerts and remote control.

  • ESG and certifications

    Traceable data for ESG reporting and the metering that BREEAM, LEED or VERDE require. And an API to bring that data into your applications.

Common areas

Common-room HVAC, from a single app.

Co-working space, gym, dining room or lobby: each room has its own schedule. If someone turns the HVAC on out of hours, it switches itself off in under a minute. And the history shows the actual temperature against the setpoint, and how long it has been on.

  • A schedule for each room. Mode, setpoint and fan setting for each time slot, and by season too.
  • Locked rooms. Rooms that are not in use remain off, even if someone touches the thermostat.
  • Live status. The temperature, setpoint and connection of every thermostat.
  • History. Over 24 hours, 7 or 30 days: hours on, connection and temperature.
Common rooms4 thermostats
  • Co-working23.6°Setpoint 22°Cool · 08–22 h
  • Dining room24.9°Setpoint 22°Off
  • Gym25.2°OfflineSince 09:12
  • Lobby23.1°LockedAlways off
Out of hoursAnything switched on in the room switches itself off in under a minute.
Sample data
History · Co-working
24 h7 days30 days
On58%
Connected100%
TemperatureSetpointOn
MTWTFSS
Sample data
For residents

The resident app

Each resident sees their own consumption on their phone, with tips on sensible use and on saving by tariff period. Their data is for them, not for the owner.

  • Their consumption, for them alone. Water, domestic hot water and energy for their home, by hour and by day.
  • Savings by tariff period. What they use at peak, mid-peak and off-peak times, and how to shift it to the cheaper hours.
  • Using the home’s systems well. Tips on everyday habits, and alerts about leaks or unusual consumption.
  • Certified building. The metering that BREEAM, LEED or VERDE require, with aggregated data.
Your home · today4.4 kWh
Off-peakMid-peakPeak
TipSet the dishwasher to run after midnight: that’s off-peak, the cheapest period.
All in orderNo water use in the early hours this week.
Sample data

The platform

What you see on the platform.

All your meters and actuators in one place: history, alerts, real-time views and remote control, with every reading validated and in context.

Active alerts
  • Out-of-hours consumptionCar park · Sunday 03:00–05:00
  • Crossflow between cold and hot waterDevelopment · block B · last 7 days
  • Continuous flow in the early hoursCommon area · possible leak
  • Meter not communicatingCommon area · 26 h ago

Data quality and alerts

The platform monitors every meter: it detects out-of-hours consumption, crossflow and reverse flow between circuits, leaks and equipment that stops communicating, and alerts you.

Remote control
  • Common-room thermostatsDevelopment · switch off at 22:00
  • Air-source heat pumpHome · raises the setpoint when there is surplus solar output
  • Door to the booked roomDevelopment · opens from the booking appWhen booked
  • Air-source heat pump setpointHome · adjusted to each tariff periodScheduled

Remote control and automation

We don’t just meter: from the platform you can switch off thermostats, open or close valves, start pumps or cut the power to equipment, or let rules based on time, temperature or consumption do it for you.

Domestic hot water tank · now
  • Top 61.8 °C
  • Upper middle 55.2 °C
  • Lower middle 41.7 °C
  • Bottom 27.3 °C

Plant in real time

Plant-room schematics with live temperatures, pumps and production, and charts covering up to 48 hours: which source is heating the water at any moment.

Development · domestic hot water by hour
00 03 06 09 11 h

Consumption by use, area and line

Energy, water, domestic hot water and gas by hour, day or month. By building, floor, home, common area, production line or machine, with comparisons between periods and export to Excel.

Tailored

Each app, built for its site.

No two sites are the same. We design each app with the people who maintain or manage the site, so that it shows their equipment, schematics, alerts and controls, and nothing they don’t need.

  • Thermostats for common areasOne app for all the thermostats in a development: a schedule for each room, anything switched on out of hours switches itself off in under a minute, and a history of the actual temperature against the setpoint.
  • Water and energy in an operator’s appEach resident sees their own water and energy use inside the operator’s app.
  • Air-source heat pump, solar PV and buffer tanksIn a home: surplus solar output is stored as heat, consumption is tracked by tariff period and the month’s bill is forecast.
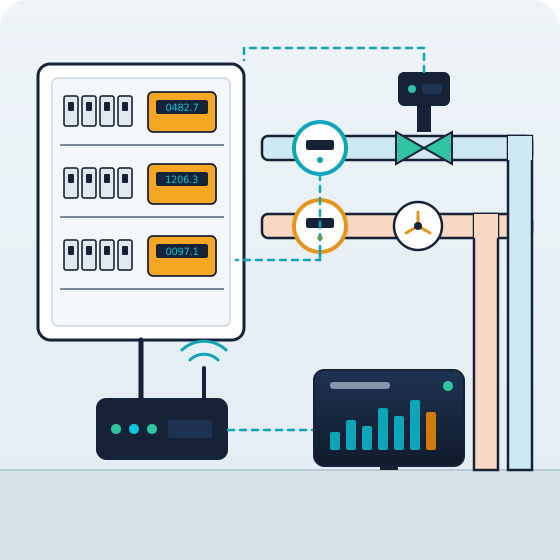
Plant room with a sub-metered distribution board, cold and hot water pipes with meters, a valve with an actuator, a pump and a gateway that sends the data to the platform
In-house installationWater, electricity, gas and HVAC

Installation included

We do the installation too.

We have our own installation team. It carries out plumbing, electrical, gas and HVAC work, and builds metering and control in from the design stage: meters in the right place, properly wired and communicating from day one.

A single point of contact. If a reading doesn’t add up, there is no need to coordinate an installer, an integrator and a software provider. We sort it out ourselves.
  • Water and plumbingCold water, domestic hot water, drainage and booster pumps.
  • ElectricalLow voltage, distribution boards, lighting and electric vehicle charging.
  • GasBuilding gas installations, boilers and compliance upgrades.
  • HVACAir-source heat pumps, VRF, heating and cooling plant, ventilation.
Frequently asked questions

What people usually ask us.

Do you only work on certifications?

No. Metering helps you save, control your systems, allocate costs and report. Certifications such as BREEAM are just one of its uses.

Are you BREEAM assessors?

No. The assessor sets the project’s metering requirements. We propose the technical solution, carry it out and give the assessor the information they need for their documentation.

Do you work in buildings that are already in use?

Yes. We install sub-metering in existing buildings and, where possible, integrate the meters that are already there.

Is the app the same for everyone?

No. We tailor each app to how each site is used and what it needs, together with its maintenance teams and owners: which equipment is shown, which schematics, which alerts and what can be controlled.

Who sees the data for each home?

In residential buildings, the detailed consumption of each home is for its resident, who sees it in their app. The owner works with the data for the building and the common areas and, where costs are allocated, only with each home’s total for each billing period.

Can you control the equipment as well?

Yes. We integrate actuators such as valves, pumps, relays or HVAC controls, and they are controlled from the platform: manually or with automatic rules based on time, temperature or consumption.

Which meters and protocols do you integrate?

Any installed meter that communicates over RS-485 (Modbus RTU) or M-Bus. We also work with LoRaWAN, using meters we install ourselves, and with Modbus TCP, BACnet, MQTT and KNX. We usually install Lobato electricity meters, Conthidra water and thermal energy meters, and Sontex 739 heat and cooling meters. You will find the details on the Integration page (in Spanish).

Do you need to stop production to install?

It depends on the site. We normally do the work during a scheduled shutdown.

What do you need from us?

Access to the distribution boards and plant rooms, and a contact person.

Can we start with just one part?

Yes. You can run a pilot on part of the site before covering all of it. We decide this with you, based on what you need.

How much does it cost, and what maintenance does it need?

It depends on what needs to be metered and on what you need. After the visit, we send you a proposal with a quote. Maintenance comes under a separate contract, tailored to each site.

Can I use the data in my own reporting?

Yes. The data can be exported or sent by API to your systems and applications, for whatever reporting you need.

Contact

Request an initial assessment.

We usually start with a no-obligation visit to your site. We look at your utility supplies, your meters and what you want to achieve, and send you a proposal with a quote.